I - Measurements In Frequency
We measure the noise for frequencies
between 1-100MHz and 100-500MHz, in two laboratories in order to compare the noise in
different places and in other hand to have more accurate measures of the noise between
these bands. The first laboratory is situated on second floor (Lab 208) and the second
is situated on third floor (Lab 328B) of the INESC-ID building. This measurement was
taken at May 6th, 2010. The results are presented below.
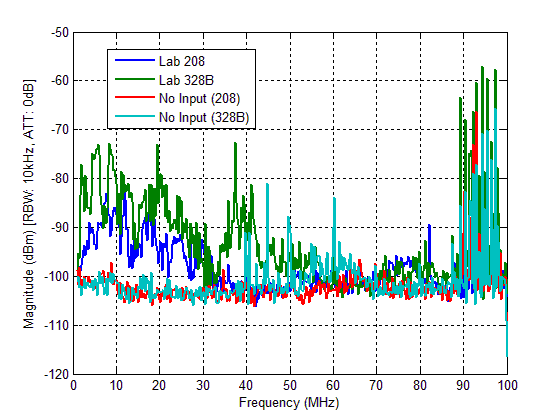
Figure 1 - NOISE PSD UP TO 100MHZ.
All data acquired and used to create this Figure, can be downloaded in Download Section or here. All data are in *.Zip file.

Figure 2 - NOISE PSD UP TO 500MHZ.
Observing the results, we can
conclude that the noise presented in the Power Line only affect the results for frequencies
up to 50MHz, since for frequencies above, the noise are mainly caused by the spectrum
analyzer. For frequencies between 50-500MHz, the spectrum is practically the same when
we have no input signal in both Labs.
All data acquired and used to create this Figure, can be downloaded in Download Section or here. All data are in *.Zip file.
We have also measure the noise when we connect an amplifier with 22dB gain between the pickup circuit and the spectrum analyzer. The results are presented below.

Figure 3 - NOISE PSD WITH THE AMPLIFIER UP TO 100MHZ.
All data acquired and used to create this Figure, can be downloaded in Download Section or here. All data are in *.Zip file.

Figure 4 - NOISE PSD WITH THE AMPLIFIER UP TO 500MHZ.
Observing the results it's possible to confirm that the noise presented at Power Line only affect the results for
frequencies up to 50MHz, since the spectrum above this frequency is practically the same
with or without input signal. The noise in this band is amplified as we expected.
All data acquired and used to create this Figure, can be downloaded in Download Section or here. All data are in *.Zip file.
In order to compare witch configuration of the spectrum analyzer were appropriate for the noise measurements,
we have done an experience changing the sensibility level of the spectrum analyzer used,
this correspond to changing the noise level of the analyzer. We also compare the results
using the Video Filter. The Video Filter is a function presented in the spectrum analyzer
which presents on screen an average of four measures for every frequency in analysis.
The results are presented below.

Figure 5 - MEASUREMENTS WITH DIFFERENT CONFIGURATIONS OF THE SPECTRUM ANALYZER.
The results above were taken without the amplifier connected between the pickup circuit and the spectrum analyzer.
All data acquired and used to create this Figure, can be downloaded in Download Section or here. All data are in *.Zip file.

Figure 6 - MEASUREMENTS WITH DIFFERENT CONFIGURATIONS OF THE SPECTRUM ANALYZER PLUS AMPLIFIER.
This measure was done with one amplifier connected between the pickup circuit and the
Spectrum analyzer.
Observing the results, we chose the High Sensibility mode to execute our measures.
This results in lower internal noise of the spectrum analyzer.
All data acquired and used to create this Figure, can be downloaded in Download Section or here. All data are in *.Zip file.
Using the LC anti-aliasing filter presented in the
Circuit Page, we had measure the noise spectrum
from 1-500MHz with and without connecting the pickup circuit to AC mains. These measures
were taken on 7 May 2010.

Figure 7 - NOISE PSD WITH LC FILTER.
These results were taken without the amplifier connected between the pickup circuit and the spectrum analyzer.
All data acquired and used to create this Figure, can be downloaded in Download Section or here. All data are in *.Zip file.
II - Measurements In Time
After analysis in frequency with the spectrum analyzer, we have measure the noise
with a digital storage oscilloscope (DSO). The DSO used was the PicoScope 3206 witch
can digitized to 8bits and is capable of recording 1 million samples with rate of
200Msamples/sec. The result is presented below:

Figure 8 - NOISE MEASUREMENT IN TIME.
The figure above present only 0.05ms of 5ms measured, with the DSO referred,
at 200Msamples/s. This measure was taken with two amplifiers in cascade between
the pickup circuit and the DSO.

Figure 9 - NOISE MEASUREMENT IN TIME WITH TWO AMPLIFIERS.
Observing the figure above, we can observe that the noise presented in power-lines is mostly impulsive.
The data acquired and used to create this Figure, can be downloaded in Download Section or here. All data are in *.Zip file.
We precede the analysis with the computation of the Power Spectral Density (PSD) using the method. The result is presented below:

Figure 10 - NOISE PSD CALCULATED USING THE AQUIRED DIGITAL SIGNAL.
We also measure the noise without connecting the two amplifiers between the pickup
circuit and the DSO in order to see how much the results differ from the above.
The results are presented below:

Figure 11 - NOISE MEASURE WITHOUT AMPLIFIERS.
The data acquired and used to create this Figure, can be downloaded in Download Section or here. All data are in *.Zip file.
The PSD is showing below,

Figure 12 - POWER SPECTRAL DENSITY WITHOUT AMPLIFIER.
To compare the noise presented in a home environment relatively to those presented in
a Laboratory, we have done a measurement in a house a compare this results with those
obtains in the laboratory. These measurements were taken on May 24th, 2010 at home and also
at the lab.

Figure 13 - COMPARISON OF THE NOISE AT HOUSE WITH THE NOISE AT LABORATORY.
All data acquired and used to create this Figure, can be downloaded in Download Section or here. All data are in *.Zip file.
In order to verify the veracity of the results taken previously, we
remake the measure with another amplifier. The amplifier used was the
Mini-Circuits ZFL-50LN+ low noise amplifier, with a 24dB gain announced.
The results of the measure are presented below.

Figure 14 - NOISE MEASURE WITH ZFL-500LN+.
The data acquired and used to create this Figure, can be downloaded in Download Section or here. All data are in *.Zip file.
Representing the Figure 14 in a small time interval, it's possible to observe the impulses.

Figure 15 - NOISE MEASURE IN A SMALL TIME INTERVAL.
This measure with only one new amplifier connecting between the oscilloscope and the
pick-up circuit developed previously. The oscilloscope used was also the PicoScope
configured to sample at rate 200Msamples/s.
The power spectral density is presented below.

Figure 16 - POWER SPECTRAL DENSITY OF THE MEASURE WITH ZFL-500LN+.
Observing the measurements taken with different amplifiers,
we can conclude that the noise is practically the same using ZFL-500+ or ZFL-500LN+.
In this case we can guarantee that the results taken are corrected.
Using the new amplifier, we measure the noise at different places, in order to compare them.
The places chosen were one house, a laboratory at INESC and a room at University.
The results are presented below.
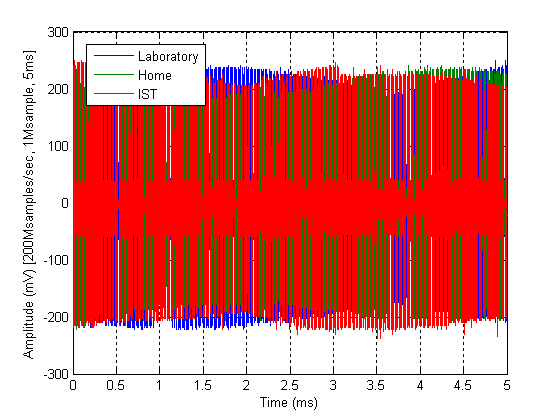
Figure 17 - COMPARING THE NOISE AT DIFFERENT PLACES.
And for a small time interval,
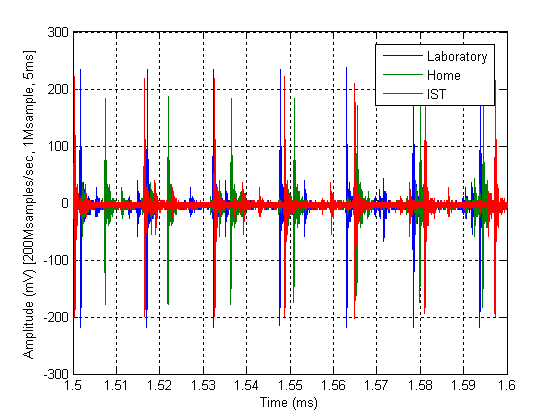
Figure 18 - COMPARING THE NOISE AT DIFFERENT PLACES IN A SMALL TIME INTERVAL.
Observing the results obtained, we can conclude that the noise present in a residential environment
is practically the same as the noise present in a laboratory environment. These measures were taken on December 17th, 2010.
All data acquired and used to create Figure 17, can be downloaded in Download Section or here. All data are in *.Zip file.
Impulsive noise noise will results in high correlation between the noise of OFDM carriers. We show a figure with the middle diagonal of the normalizes covariance matrix (correlation coefficients matrix). The correlation coefficient values can be as high as 0.9 in this case. The OFDM symbols had a length of 2467 samples at 200 MHz. Note that the correlation coefficient would be lower if the symbols were shorter.
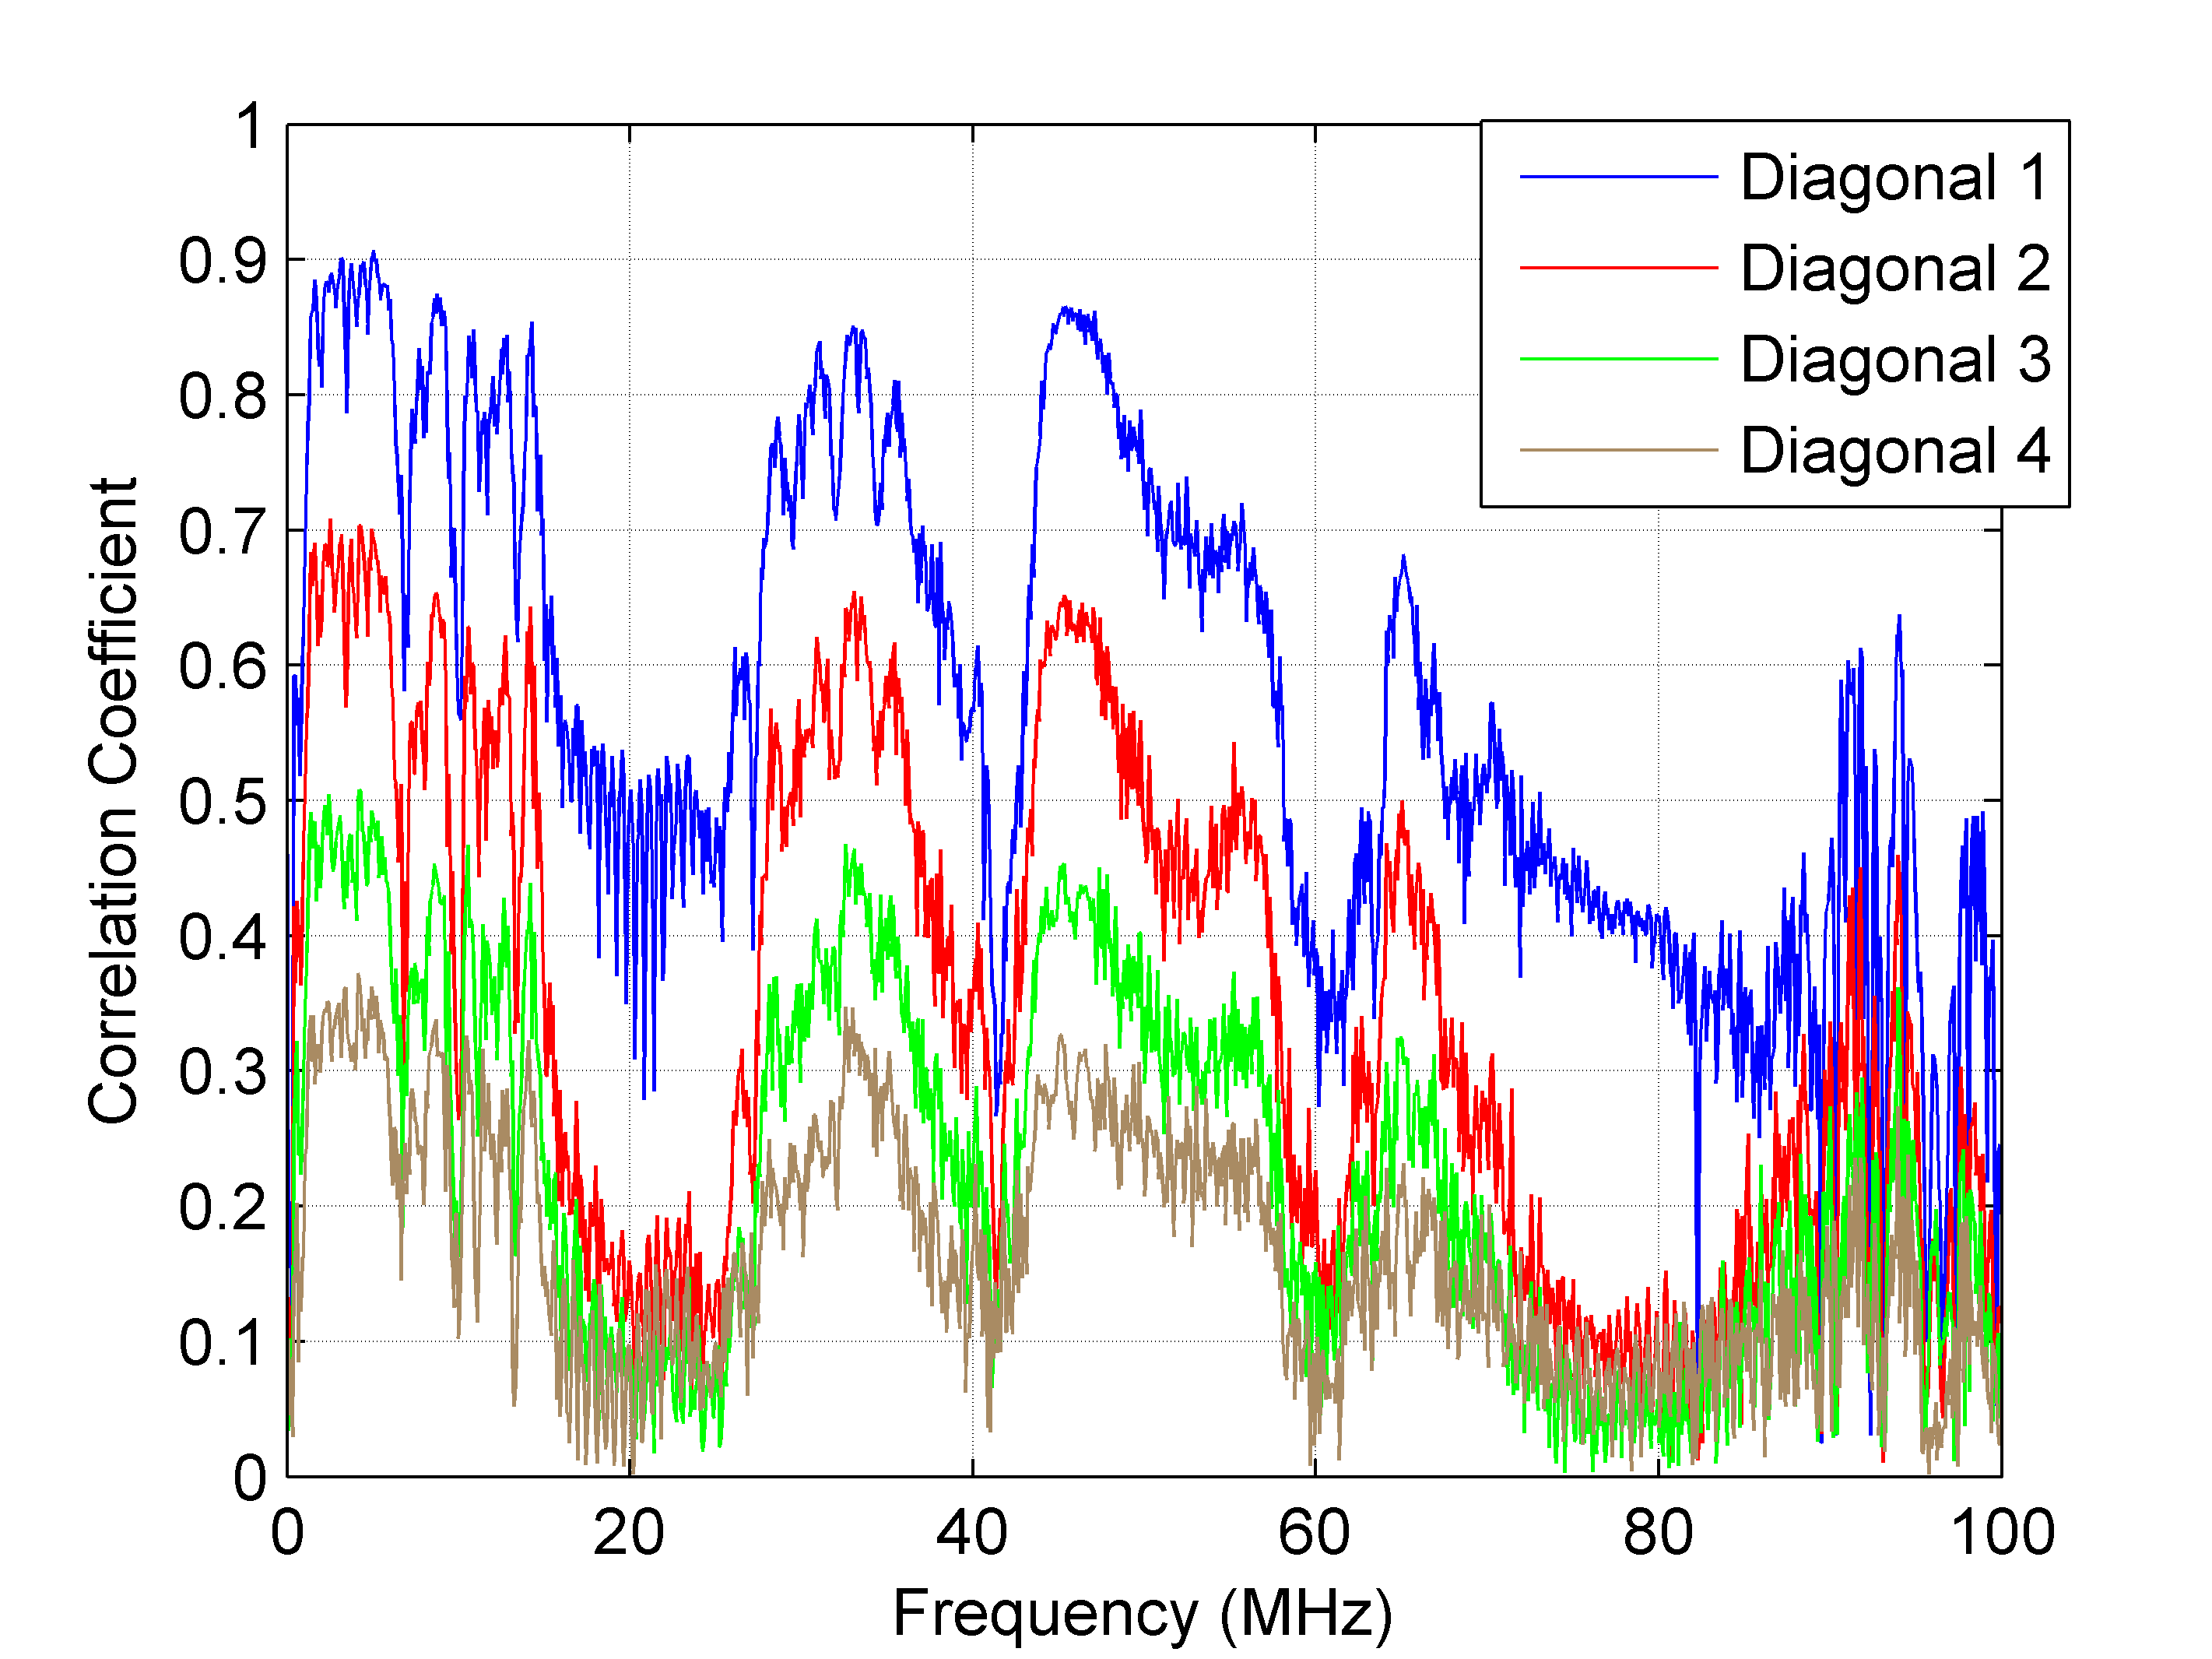
Figure 19 - Correlation Coefficients of the noise between OFDM carriers.